Analytics
Overview
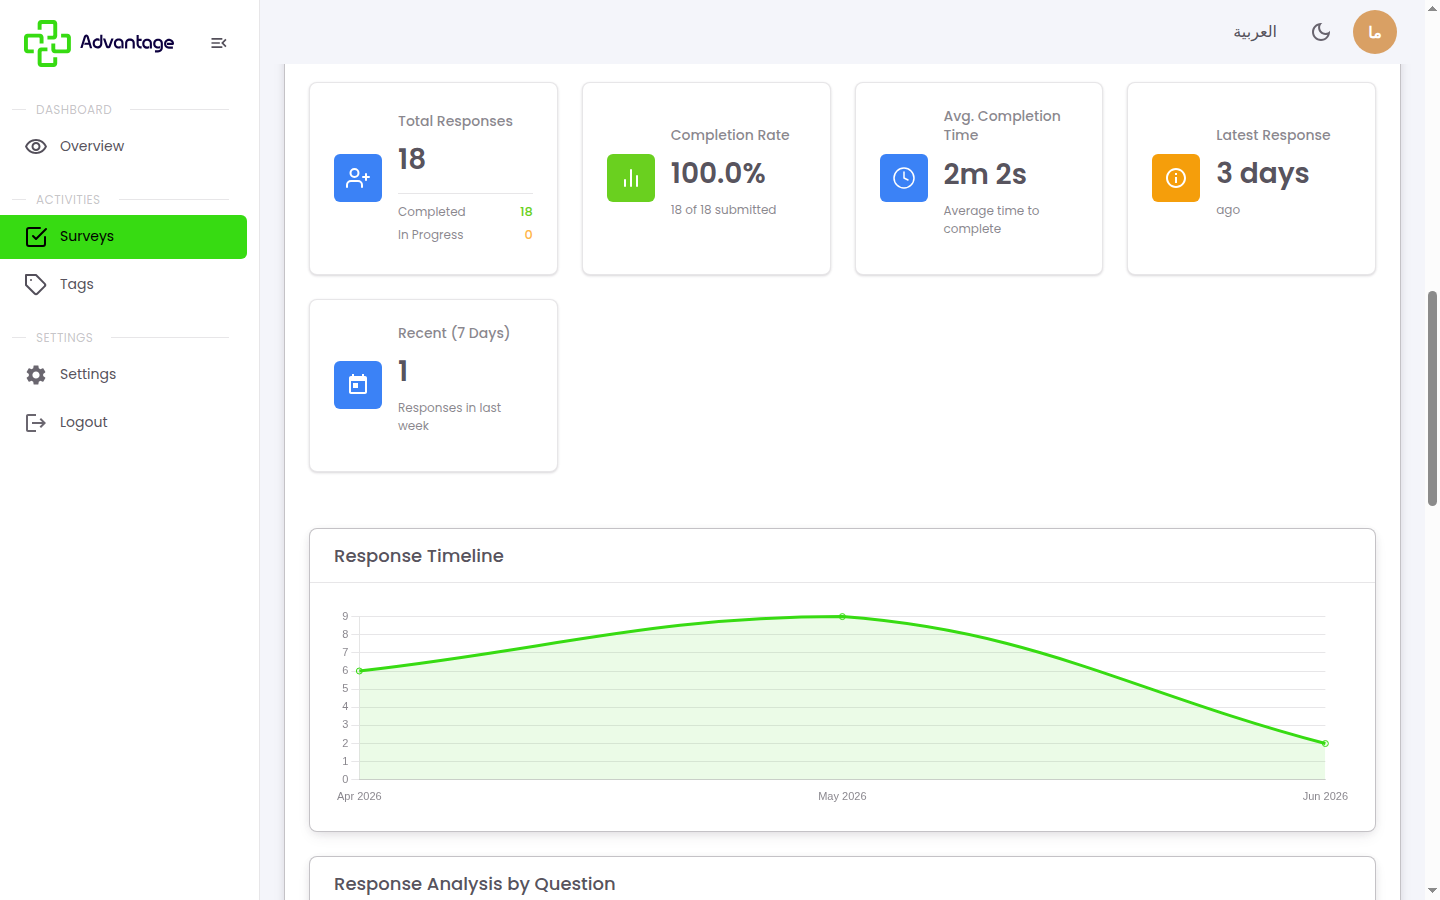
A survey's analytics summarize your results — total responses, completion rate, average completion time, a responses-over-time chart, per-question distribution charts, and a CX score for NPS, CSAT, and CES survey types.
When to use it
- You want to understand how people answered and how the survey performed.
- You're reporting on an NPS, CSAT, or CES survey and need the score.
Before you start
- The survey needs responses before the analytics are meaningful.
- A headline score shows only for NPS, CSAT, and CES; eNPS and PMF are not auto-scored.
Step by step
-
Open the survey to see its analytics.
-
Read the headline metrics: total responses, completion rate, and average completion time.
-
Scroll the responses-over-time chart and the per-question distribution charts — these always show, for every type.
-
For NPS, CSAT, and CES, read the CX score at the top:
- NPS: the score plus the promoters / passives / detractors breakdown.
- CSAT: a satisfaction percentage.
- CES: an average ease score.
Good to know
What is the completion rate? It's the share of people who finished the survey out of everyone who started it (finished ÷ started).
Why is there no score for an eNPS or PMF survey? The system only auto-computes a score for NPS, CSAT, and CES. eNPS and PMF raw responses still appear in the per-question distribution charts, but with no headline score.
Can I compare results across surveys? Yes — surveys that share a tag can be compared, so you can track a metric over time or across campaigns.
Tips & pitfalls
Tip: A low completion rate often means the survey is too long — trimming questions usually helps.
Warning: Small response counts make scores volatile — gather enough responses before drawing conclusions.
Next steps
Export the responses for deeper analysis outside the platform.