Analytics
Overview
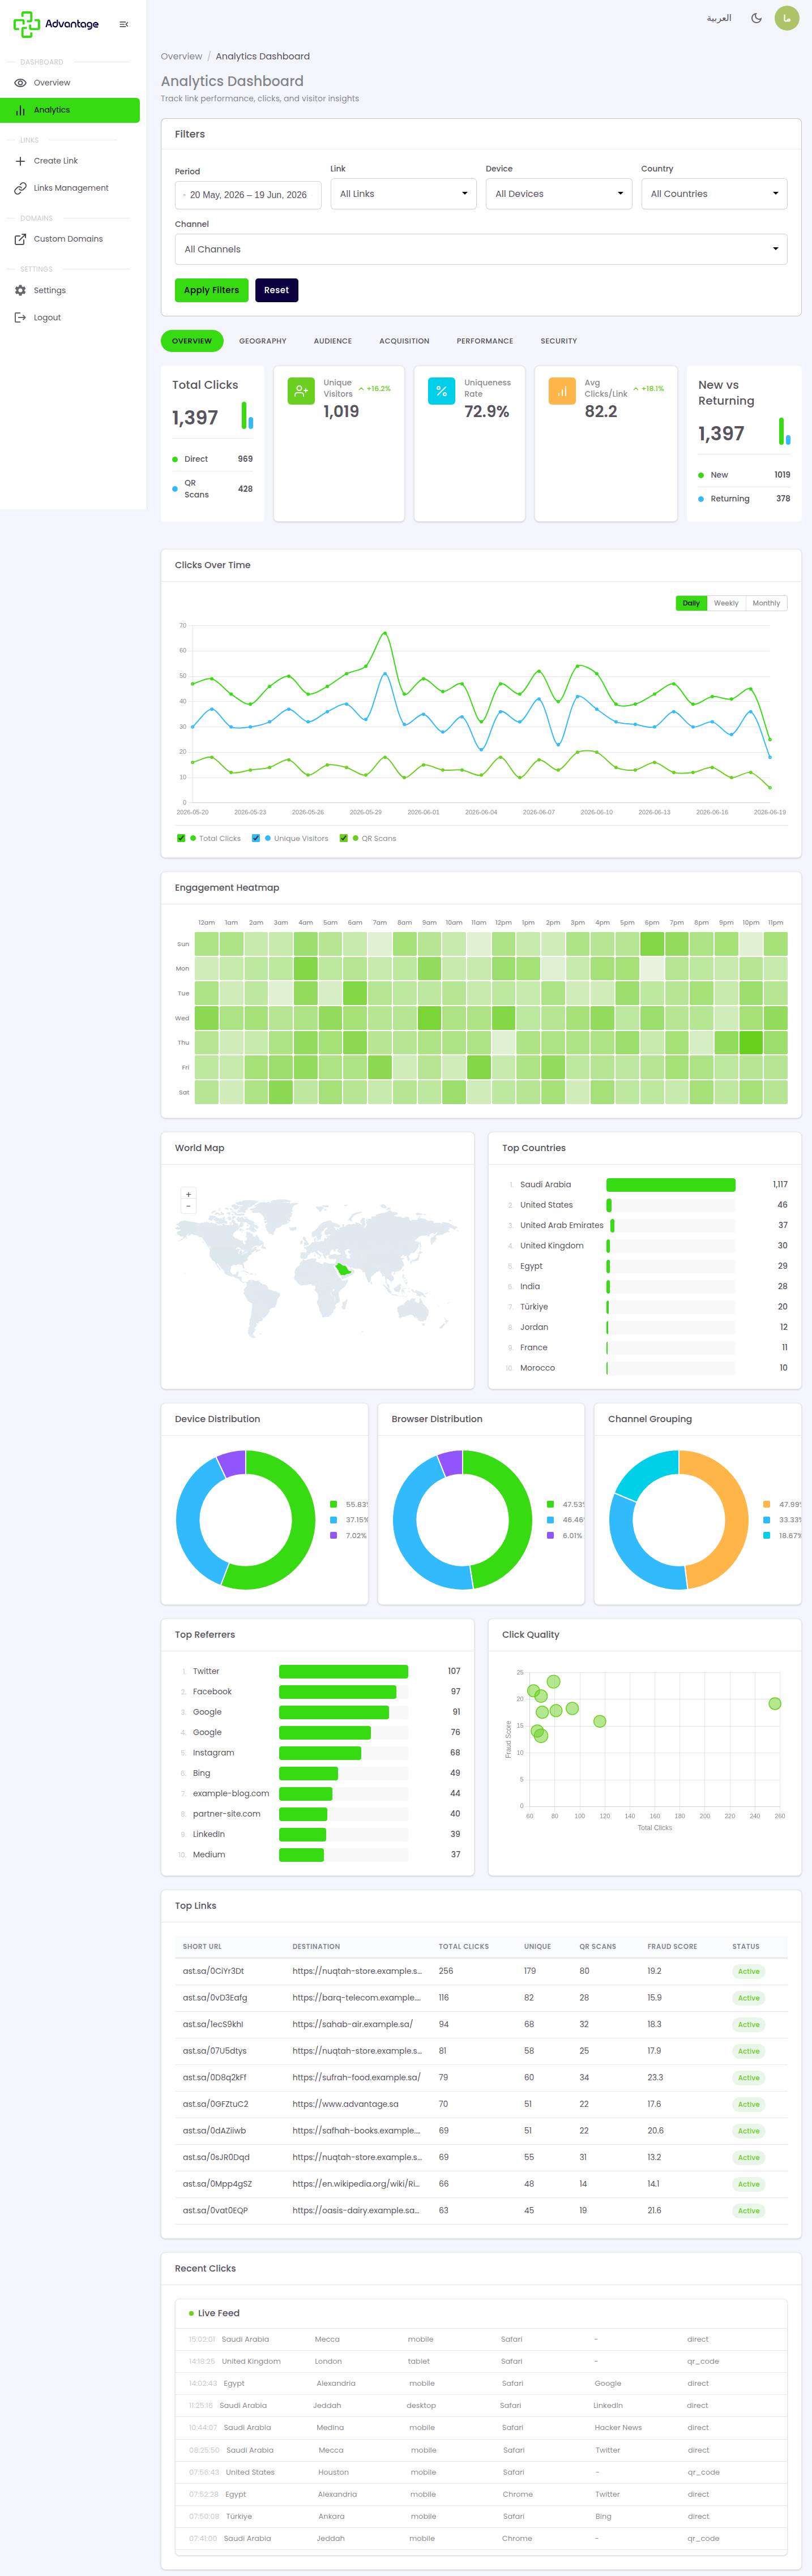
The Analytics dashboard breaks your link performance into tabs — where clicks come from, who's clicking, how they arrived, which links win, and whether the traffic is real.
When to use it
- You're measuring a campaign and want detail beyond the overview.
- You suspect bot or fraudulent traffic and want to check.
Before you start
- You need links with some click history for the charts to be meaningful.
- Decide on the date range — and whether you want to compare two periods.
Step by step
-
Open Analytics and switch between the tabs — Overview, Geography, Audience, Acquisition, Performance, and Security — to explore your data. Set the date range, enable compare to see the change versus a prior period, and export any tab to CSV.
Good to know
What does each tab answer? Geography shows where, Audience shows who, Acquisition shows how they arrived, Performance shows which links, and Security shows whether they're real.
What do the Security tab flags mean? The Security tab classifies bot vs human traffic, gives a fraud score, and flags VPN, proxy, Tor, and datacenter sources.
How fresh is the data? It's near real-time, but very recent clicks may take a short time to appear.
Tips & pitfalls
Tip: Use compare mode to measure a campaign's lift against the period before it.
Warning: Very recent clicks may take a short time to appear, so today's totals can be slightly behind.
Next steps
- Dashboard — for a quick overview of all your links.
- Managing links — to edit links based on what you see.